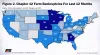
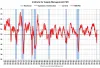
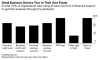
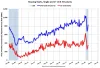
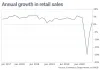
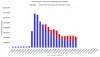
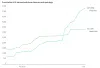
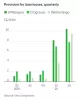
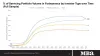
A visual peek at the state of the economy Min Max Posted Chapter 12 Farm Bankruptcies for the Last 12 Months Aug 05, 2020 Manufacturing Expanded for Third Consecutive Month in July Aug 04, 2020 Survey of How Small Businesses Are Supporting Their Operations During the Pandemic Aug 03, 2020 Housing Starts Increased in June Jul 22, 2020 Number of Homeowners in COVID-19-Related Forbearance Plans Decline Jul 21, 2020 Annual Growth in Retail Sales Since July 2017 Jul 20, 2020 Initial Regular Weekly Employment Claims and Pandemic Unemployment Assistance Jul 17, 2020 Cumulative U.S. Announced Store Closures and Openings Since January Jul 16, 2020 Big Banks Prepare Greater Provisions for Loan Losses in 2Q 2020 Jul 15, 2020 Percent of Mortgage Servicing Portfolio Volume in Forbearance by Investor Type Since March 8 Jul 14, 2020 Pagination « First First page ‹ Previous Previous page … 54 55 56 57 58 59 60 61 62 … Next › Next page Last » Last page