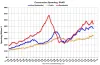
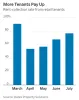
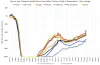
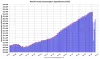
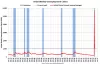
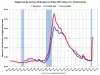
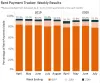
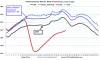
A visual peek at the state of the economy Min Max Posted Construction Spending Since 1993 Sep 02, 2020 Rent-Collection Rate from Retail Tenants Since March Sep 01, 2020 Year-over-Year Change in Seated Restaurant Reservations Aug 31, 2020 Personal Spending Increased in July Aug 28, 2020 Recent Initial Weekly Unemployment Claims Reported at More than 1 Million Aug 27, 2020 Serious Delinquency Rate on Single-Family Home Mortgages Increased in July Aug 26, 2020 Weekly Rent Payment Tracker Aug 25, 2020 Hotel Occupancy Rate by Week of Year Aug 24, 2020 Nearly 3.9 Million Homeowners Remain in Active Forbearance as of August 18 Aug 21, 2020 Initial Unemployment Claims Increase from Previous Week Aug 20, 2020 Pagination « First First page ‹ Previous Previous page … 52 53 54 55 56 57 58 59 60 … Next › Next page Last » Last page