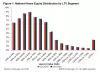
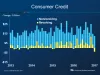
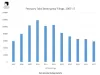
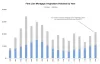
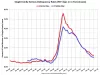
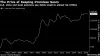
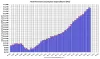
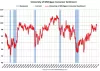
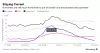
A visual peek at the state of the economy Min Max Posted National Home Equity Distribution by LTV Segment, Q3 v. Q4 2016 Mar 09, 2017 Changes in Consumer Credit, Nonrevolving and Revolving, Since 2013 Mar 08, 2017 February Total Bankruptcy Filings, 2007-17 Mar 07, 2017 Mortgage Origination Volumes by Year Since 2000 Mar 06, 2017 Serious Delinquency Rate on Single Family Homes Unchanged in January Mar 03, 2017 State and Local Pension Debt Swells to Almost $2 Trillion Mar 02, 2017 Personal Consumption Expenditures over the Last 10 Years Mar 01, 2017 Consumer Sentiment Index Since 1978 Feb 27, 2017 Shares of Consumer Debt 90+ Days Late Feb 24, 2017 Puerto Rico General Obligation Bond Prices Since 2014 Feb 23, 2017 Pagination « First First page ‹ Previous Previous page … 123 124 125 126 127 128 129 130 131 … Next › Next page Last » Last page